The Suppressed Vote In The South
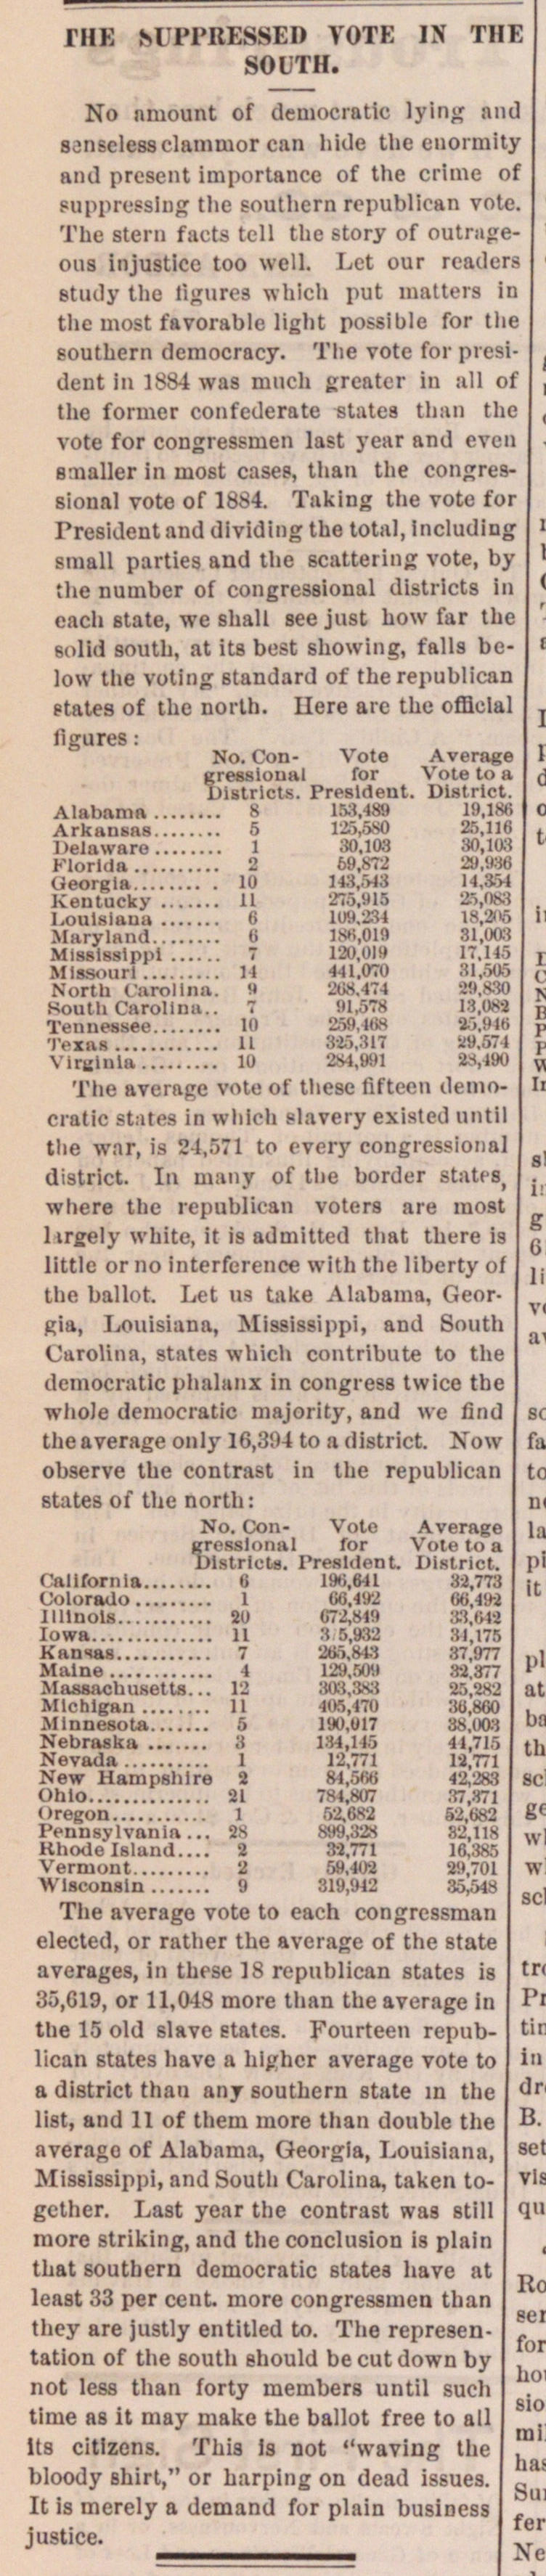
No nmount of democratie lying and sanselessclammor can hide the enorniity and present importanee of the crime of rapprMtlog the southern republican vote. The stern faets teil the story of outnifreous injusticc too wcll. Let our readers stuily the ftgurei whieli put matten in the most favorable light possible for the southern democracy. The vote for president in 1884 was much greater in all of the former confedérate statea tban the vote for congressnien last year and even smaller in most cases, than the congressional vote of 1884. Tuking the vote for President and dividing the total, Including small parties and the Ktttering vote, by ;he number of congressional distrlcts in each state, we sliall see just how far the ¦oBá south. at its best showing, falla below the voting standard of the republican states of the noilh. Ilere are the official ligures : No. ConVote Average gressloual for Vote to a Dlitrlota. President. District. Alabamn 8 1M.48 19.18B Arkansas 5 125,5S0 25,116 Delawaro 1 30,103 30,103 Klorlda 2 6972 U9.98Í Georgia 10 MêJHt 14,854 Kentucky 11 275,915 3088 Loulsiaua 6 lug.284 Marrland u Wfil9 81,008 Misslsslppl 7 120.UMI IT.HÓ Missouri 14 111.070 81,006 Nortli Carolina. ÍU,tU South Carollnii.. 7 9178 18,081 Tennessee 10 25í).liiÍ5.94Í ¦IVxus 11 UT a,S74 v i t-.- ¦ i-i ui 'si'mi 2H.iati The average vote of these fiftcen democratie statcs in wliich slavery existed uiitil the war, ia 24,671 to every congressional district. In many of tlie border states, where the republican voters are most 1 irgely white, it is aümittcd that tlu-re is littlc or no interference with tlie liberty of the ballot. Let us take Alabama, Georgia, Louisiana, Mississippi, and South Carolina, states which contribute to the democratie phalanx in congress twice the whoJe democratie majority, and we find the average only 16,394 to a district. Now observe the contrast in the republican states of the north : No. ConVote Average grcsslmml for Vote to a UiMriels. President. District. California 6 1,1 32,773 Colorado 1 0,492 06,492 Illinois 20 C72,S49 33,843 Iowa 11 .'2 H.17B Kansas 7 'MiMt .7,77 Malne 4 V2S),M.i : :77 Massachusetts... U Wjl H,S83 Michigan 11 mï,l70 :iu,800 Minnesota 5 19Ü.U17 m,m Nebraska ;) 1:I,1I5 41,715 Nevada 1 12,771 1-,771 New Hampshire 2 84JSO8 42,2X3 OhiO 81 784,807 VtJn Oregon 1 52,682 2,682 Pennsylvania... Í8 8S9..Í2S 82,118 Khcxlelsland.... ¦ ".2.771 16,385 Vermont 2 X.TO1 WIsconsin 9 319,'.U2 35,548 The average vote to each congressman elected, or rather the average of the state averages, in these 18 republican states is 35,619, or 11,048 more than the average In tlie 15 old slave etates. Fourteen republican states have a highcr average vote to a district thau any southcrn state in the list, and 11 of tliem more than doublé the averago of Alabnma, Georgia, Louisiana, Mississippi, and South Carolina, taken together. Last year the contrast was still more striking, and the conclusión is plain that southern democratie statea have at least 33 per cent more congressmen than they are justly entitled to. The representation of the south should be cut down by not less than forty members until such time as it niay make the ballot free to all lts citlzens. This Is not "waving the bloody Bhirt," or harping on dead issues. It is merely a demand for plain business justice.
Article
Subjects
Ann Arbor Courier
Old News